
Does the ViaBTC Mining Guide Cover Bitcoin Mining Rewards?
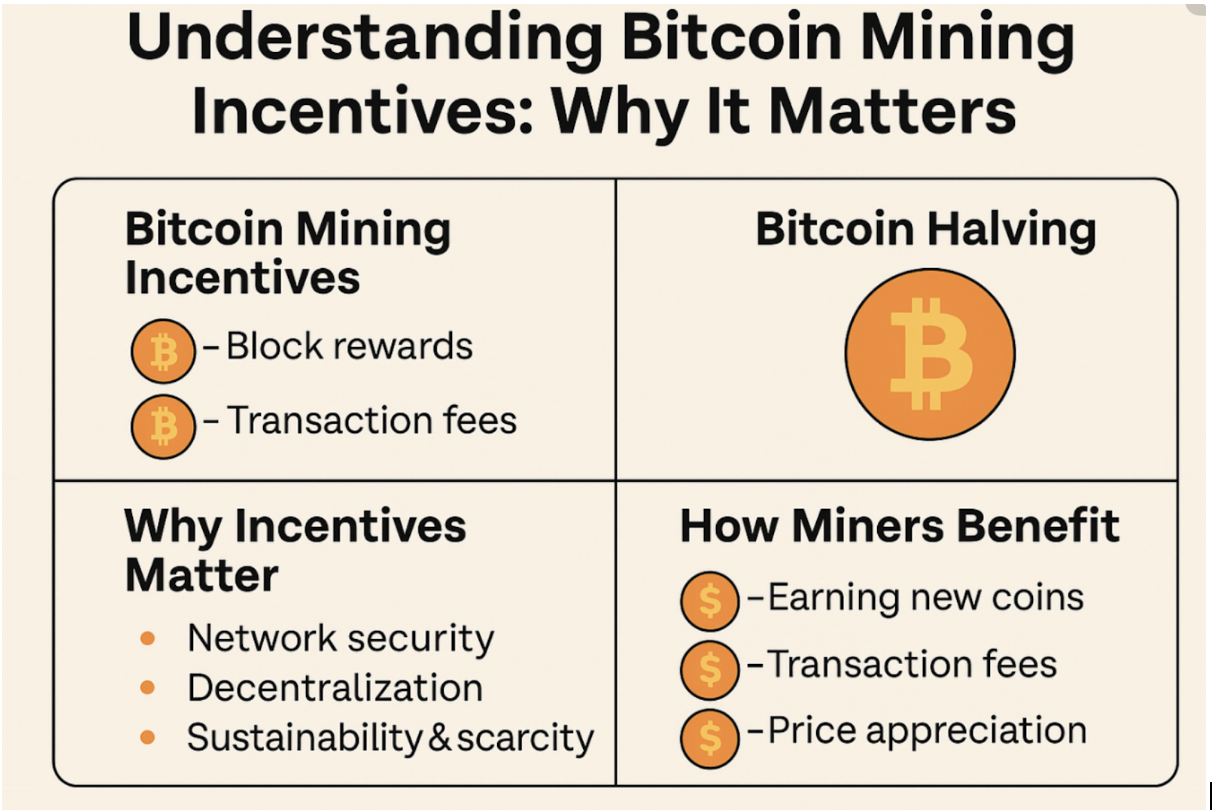
Yes. The ViaBTC mining guide can cover Bitcoin mining rewards at both the network and pool-account level. Since the April 2024 halving, Bitcoin’s block subsidy has been 3.125 BTC, down 50% from 6.25 BTC. A miner’s actual payment, however, depends on contributed hashrate, accepted shares, the selected payment method, pool fees, transaction-fee allocation, network difficulty, and uptime. ViaBTC supports pool-based mining models such as PPS+, PPLNS, and SOLO, so reading reward data requires more than checking the Bitcoin block subsidy. Electricity price and ASIC efficiency also matter when comparing mined BTC with operating cost.
Bitcoin creates a new block roughly every 10 minutes, giving the network a target of about 144 blocks per day. At the 3.125 BTC subsidy introduced in 2024, that works out to about 450 newly issued BTC per day before transaction fees. A pool miner receives only a portion of that mining income because thousands of machines may contribute computing power to the same pool.
That distinction explains why a guide for ViaBTC Bitcoin Mining needs to cover pool accounting as well as Bitcoin’s issuance schedule. The protocol determines how much BTC a block can create, while the pool records submitted work and distributes payments under its selected method.
A 100 TH/s ASIC does not earn a fixed amount of BTC per day. Its expected production changes when Bitcoin network difficulty changes, even if the machine continues reporting exactly 100 TH/s for all 24 hours.
Bitcoin’s issuance history provides useful context for the current reward. The subsidy started at 50 BTC in 2009, dropped to 25 BTC in 2012, 12.5 BTC in 2016, 6.25 BTC in 2020, and 3.125 BTC in 2024. Each scheduled halving reduced the subsidy by 50%, while transaction fees remained separate.
| Halving period | Subsidy per block | Approx. BTC/day from subsidy |
|---|---|---|
| 2016–2020 | 12.5 BTC | 1,800 BTC |
| 2020–2024 | 6.25 BTC | 900 BTC |
| 2024–2028 | 3.125 BTC | 450 BTC |
The table describes protocol issuance, not what one pool member receives. A block can also contain transaction fees paid by Bitcoin users. If a block contains 0.35 BTC in fees during the 2024–2028 subsidy period, its combined miner compensation is 3.475 BTC before any pool-level distribution rules are applied.
Fee income can vary much more than the subsidy because block-space demand changes from hour to hour. During periods of heavy Bitcoin activity, fees can represent a larger percentage of total block compensation; during quieter periods, the 3.125 BTC subsidy can account for most of it. Pool payment methods therefore deserve attention when comparing displayed earnings.
ViaBTC offers different mining payment approaches, including PPS+, PPLNS, and SOLO for supported mining arrangements. PPS-style accounting generally pays qualifying mining work according to submitted shares, reducing the miner’s exposure to short-term differences in how frequently the pool finds blocks. PPLNS links payment more closely to shares counted within a specified window.
Pool participation changes payment frequency, not Bitcoin’s monetary policy. The Bitcoin network still targets one block about every 10 minutes and still follows the subsidy schedule established by the protocol.
SOLO mining has a different payment profile. A participant is seeking the much larger payment associated with finding a block rather than receiving the smaller, more regular allocations common in shared pool mining. For a miner representing only 0.001% of relevant network computing power, the probability profile is very different from that of a large pool.
Hashrate therefore needs to be read together with network competition. Bitcoin measures mining difficulty and adjusts it every 2,016 blocks, which is approximately 14 days when blocks average 10 minutes. The adjustment is intended to bring average block production back toward the 10-minute target after network computing power rises or falls.
Suppose an operation provides 200 TH/s and the wider network grows by 10% while the miner remains at 200 TH/s. Other conditions being equal, the miner’s relative share of total computing work becomes smaller. Expected BTC production per unit of hashrate can decline even though the ASIC has no technical fault.
Short reporting windows add another source of variation. Mining dashboards estimate hashrate from submitted shares, so a machine rated at 200 TH/s does not need to display exactly 200 TH/s every minute. Comparing a 24-hour average with the machine’s rated performance is generally more informative than reacting to a brief 10-minute reading.
Accepted and rejected shares provide more context. If a worker submits 100,000 shares and 99,000 are accepted, its acceptance rate is 99%. A rejected-share rate rising from 1% to 4% leaves a smaller proportion of submitted work eligible under the pool’s accounting rules, so connection quality and worker configuration deserve review.
Electricity then separates mining revenue from operating economics. Consider an ASIC consuming 3.5 kW continuously. Over 24 hours it uses 84 kWh. At $0.05 per kWh, electricity costs $4.20 per day; at $0.10 it costs $8.40; at $0.15 it reaches $12.60.
| Electricity rate | Daily cost at 3.5 kW | 30-day cost |
|---|---|---|
| $0.05/kWh | $4.20 | $126 |
| $0.10/kWh | $8.40 | $252 |
| $0.15/kWh | $12.60 | $378 |
A difference of $0.10 per kWh produces a $252 monthly difference for one 3.5 kW machine operating continuously. Across 100 identical ASICs, the difference becomes about $25,200 over a 30-day month, before cooling, maintenance, facility costs, or downtime are counted.
Hardware efficiency changes the comparison again. ASIC efficiency is commonly measured in joules per terahash, or J/TH. A 200 TH/s machine operating at 20 J/TH requires about 4,000 watts at the stated efficiency, while 200 TH/s at 30 J/TH corresponds to about 6,000 watts. The second setup uses 50% more power for the same nominal hashrate.
Uptime also changes how much work reaches the pool. A machine available 99% of a 30-day month loses about 7.2 hours to downtime; at 95% availability, lost time reaches roughly 36 hours. Two identical 2024-generation ASICs can therefore report different monthly mining totals even when their specifications are the same.
Pool statistics should be read as a group: average hashrate, worker uptime, accepted shares, rejected shares, payment method, settled balance, and payment records provide more information than a single daily BTC figure.
Transaction fees add another layer because they are paid by users rather than issued through the subsidy. If one block pays 3.125 BTC in subsidy plus 0.50 BTC in fees, fees represent about 13.8% of the 3.625 BTC combined compensation. A block with only 0.05 BTC in fees would place the fee share at roughly 1.6%.
The 2024 halving made that distinction more relevant. Before the halving, a block with 0.50 BTC of fees and a 6.25 BTC subsidy contained 6.75 BTC in combined compensation. After the subsidy fell to 3.125 BTC, the same 0.50 BTC fee amount would produce 3.625 BTC, a reduction of about 46.3% rather than exactly 50%.
A miner comparing daily records should also separate BTC-denominated production from fiat-denominated revenue. If an operation mines 0.001 BTC, the amount remains 0.001 BTC regardless of the market quotation at that moment. Its dollar or euro equivalent changes with Bitcoin’s market price, while electricity bills may remain relatively stable under a fixed energy contract.
Pool fees must be included in the same comparison. A hypothetical 2% charge on 0.010 BTC of eligible mining income equals 0.0002 BTC, leaving 0.0098 BTC before considering other expenses. Actual charges depend on the coin, service, and payment method, so the current pool terms should be checked rather than assuming one percentage applies everywhere.
Difficulty can have a larger effect over longer periods. A miner whose hashrate remains unchanged through several 2,016-block adjustment periods may see expected BTC production move as the network adds or removes computing capacity. Comparing records from 2023 with records from 2026 without accounting for difficulty and the 2024 halving would therefore produce a poor like-for-like comparison.
For practical monitoring, a miner can compare several measurements together:
-
24-hour average hashrate versus the ASIC’s expected TH/s.
-
Accepted-share percentage and rejected-share percentage.
-
Worker uptime over 24 hours, 7 days, and 30 days.
-
BTC credited under the selected PPS+, PPLNS, or SOLO arrangement.
-
Electricity consumed per day and cost per kWh.
-
Network difficulty across each 2,016-block adjustment.
-
Transaction-fee contribution relative to the 3.125 BTC subsidy.
A 30-day record is usually more useful for operating comparisons than one unusually high or low day. For example, recording daily hashrate, accepted-share rate, BTC credited, kWh consumed, and downtime creates 30 observations per machine each month, allowing a miner to distinguish a recurring equipment issue from normal short-term variation.
The ViaBTC mining guide can therefore cover Bitcoin mining rewards in a practical sense when it explains how protocol rewards reach a pool account. Bitcoin supplies the 3.125 BTC subsidy and transaction fees; the mining pool measures contributed work and applies its payment rules; the miner then compares credited BTC with electricity, equipment performance, pool charges, and downtime.
For someone evaluating ViaBTC Bitcoin Mining after the 2024 halving, the most useful reading is not “3.125 BTC per block” by itself. A realistic assessment uses the block subsidy, fee component, 2,016-block difficulty cycle, worker hashrate, share acceptance rate, payment method, power consumption, electricity rate, and at least several weeks of account records together.
Drill the math until it's instinct
The free in-browser trainer shows you the EV of every hold, in under 200ms. No download, no account required.
Play the Free Trainer